March 2026
An Energy Shock Repriced the Global Macro Narrative
March was the month the market narrative changed. What began as an uneasy backdrop
shaped by softer growth, tariff uncertainty, and a broad reassessment of AI winners and
losers turned into something more consequential: an oil shock. The war involving the U.S.,
Israel, and Iran drove the biggest one-month increase in global oil prices on record,
forcing investors to reprice inflation risk, central bank expectations, and the margin for
error across risk assets. By month end, the conversation had shifted from a standard
growth scare to a more difficult stagflation debate.
That shift showed up clearly across markets. Global stocks suffered their worst month
since September 2022, European equities posted their steepest monthly decline in nearly
four years, and bond markets sold off as investors moved away from the view that 2026
would be defined by easier policy. Even the strong rally on March 31 did little to change
the broader picture: March was a reset month, not a reassurance month.
Noteworthy Developments
The Market Moved From Disinflation Hope to Stagflation Risk
The most important development was the escalation in Iran and the impact on energy
prices. Brent crude ended March above $100 per barrel, after at one point settling above
$118 for the expiring front-month contract, and Reuters described the move as the biggest
one-month increase in global oil prices in history. U.S. gasoline prices also moved back to
roughly $4 per gallon, reinforcing the sense that this was not just a commodity move, but
a potential macro headwind for consumers and inflation expectations.
At the same time, central bank expectations changed quickly. The Federal Reserve left
rates unchanged on March 18 and said economic activity had been expanding at a solid
pace, job gains had remained low, and inflation was still somewhat elevated. But by late
March, markets were no longer focused on when the Fed might cut. They were focused
on whether higher energy prices would keep policy tighter for longer, or even reintroduce
hike risk. Futures markets had moved from pricing rate cuts to factoring in the possibility
of rate increases.
And this was not just a U.S. story. The ECB also held rates steady on March 19, while
explicitly acknowledging that the war in the Middle East had made the outlook
significantly more uncertain by creating upside risks to inflation and downside risks to
growth. The Bank of England similarly left its Bank Rate unchanged at 3.75%, citing the
conflict and its inflation implications. The month served as a reminder that global central
banks are still navigating inflation first, even as growth becomes less comfortable.
U.S. Equities
A Tough Month for Risk Assets
U.S. equities ended March with meaningful monthly declines, even after a sharp relief
rally on the final trading day. The S&P 500 fell 5.1% on the month, while other U.S. equity
indices (the Dow, Nasdaq, and Russell 2000) were also down 5.4%, 4.8%, 5.2%
respectively. That is notable because it was not just a narrow tech correction. By month
end, the drawdown had broadened into a more generalized de-risking episode.
The drivers were fairly clear. Rising oil prices pressured the inflation outlook. Treasury
yields backed up sharply. And the market was already dealing with unresolved concerns
around AI-related disruption, private credit stress, and tariff uncertainty. In the end, Q1
marked the S&P 500’s worst quarter in four years.
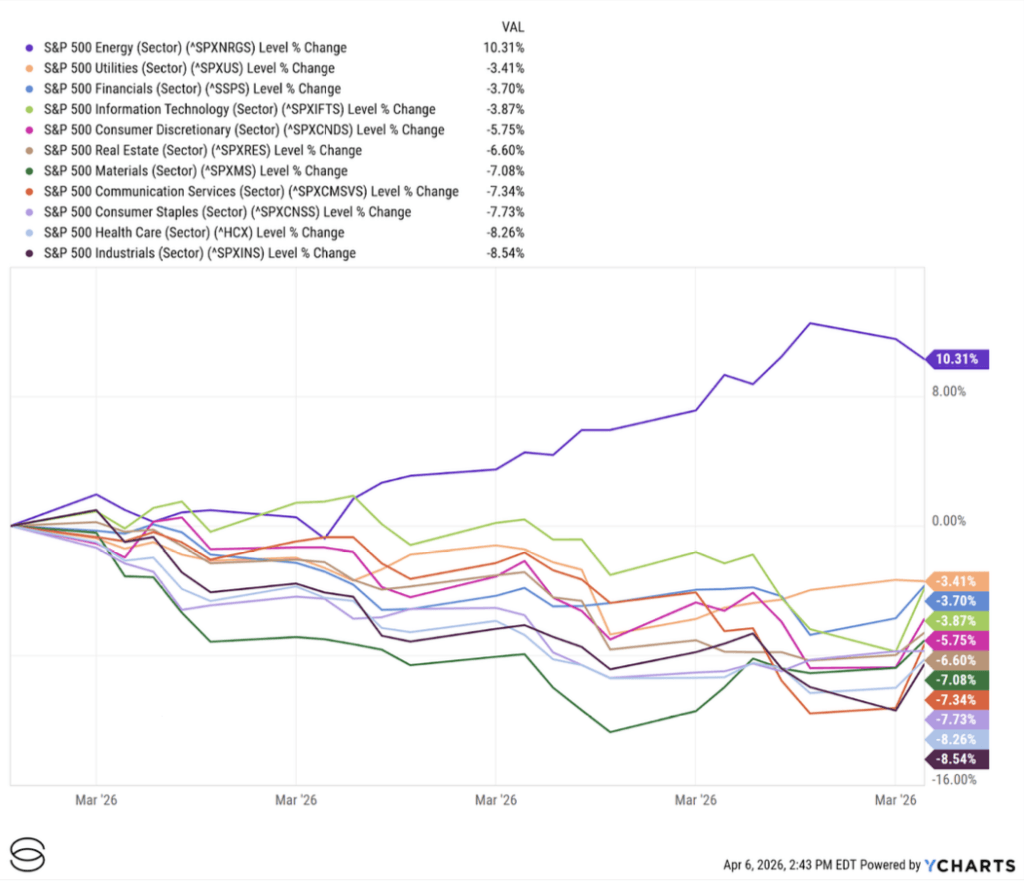
Leadership also rotated in a way that fit the macro tape. While all Magnificent Seven
stocks and other higher-duration growth exposures finished down in the quarter, energy
stocks remained the relative standout through much of the month, logging a 13-week
winning streak by late March.
Exhibit 1: U.S. Equity Performance (March 2026)
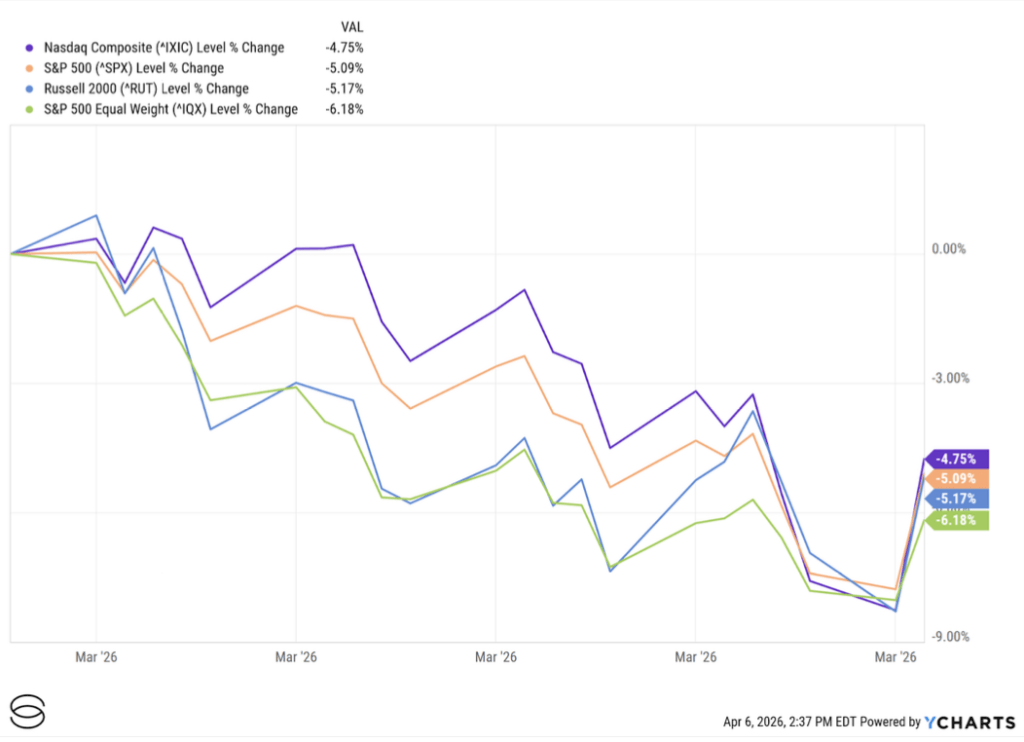
Exhibit 2: U.S. Sector Performance (March 2026)
International Markets
The Oil Shock Went Global
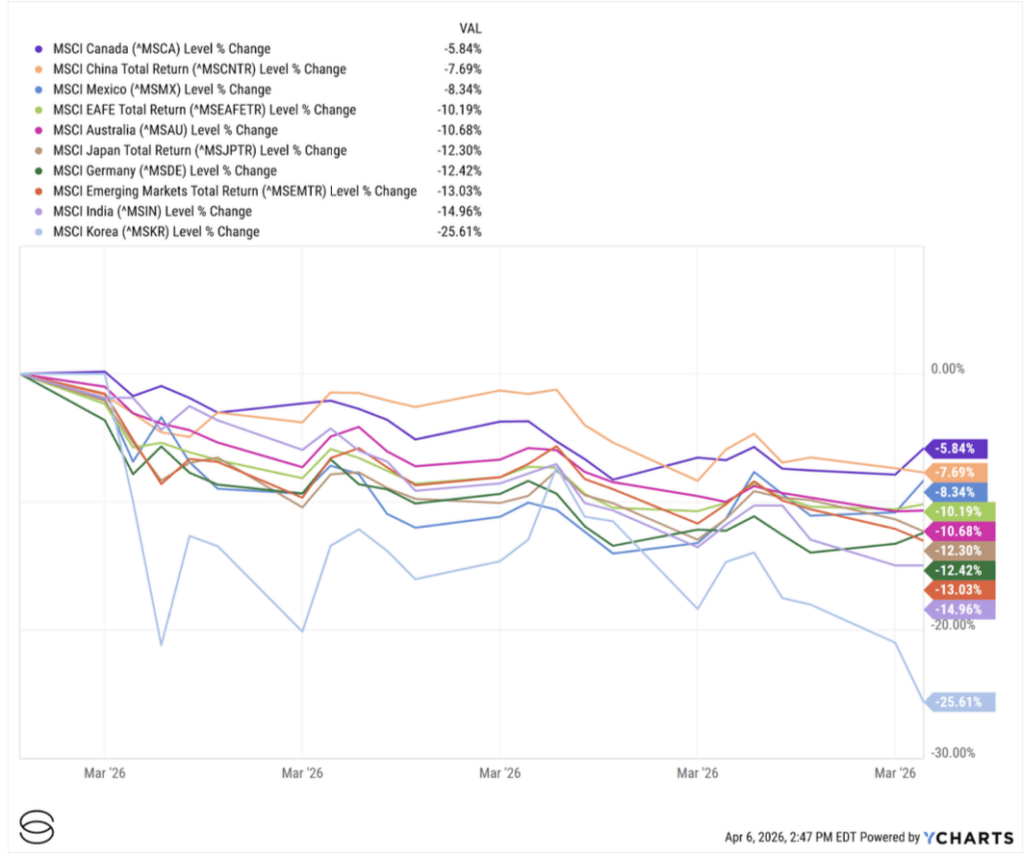
International markets fared worse than the U.S. during March’s drawdown. Europe’s
STOXX 600 index fell 8.0%, its worst month since 2022 and its steepest monthly decline
in nearly four years. Globally, March was the worst month for world stocks since
September 2022, with roughly $8 trillion in total market capitalization erased.
Asia was hit particularly hard as much of the region remains sensitive to imported energy
costs. Jittery investors pulled over $50 billion from Asian equities in March, the largest
monthly outflow since at least 2008, as higher oil, rising global yields, and stagflation
fears hit markets such as Taiwan, South Korea, and India. In a way, this reinforced how
quickly a geopolitical shock can move from the energy complex into equities, currencies,
and capital flows.
China was a partial offset, though not a full one. Beijing set its 2026 growth target at 4.5%
to 5.0%, signaling a willingness to tolerate somewhat slower growth while still supporting
the economy. That helped to support the view that China may be relatively better
insulated than some other markets, but it was not enough to fully offset the drag from the
broader oil shock and global risk-off move.
Exhibit 3: International Market Performance (March 2026)
Fixed Income and Commodities
Bonds Lost Their Cushion While Oil Took Center Stage
Cross-asset performance in March told a clear story: the nature of the shock mattered.
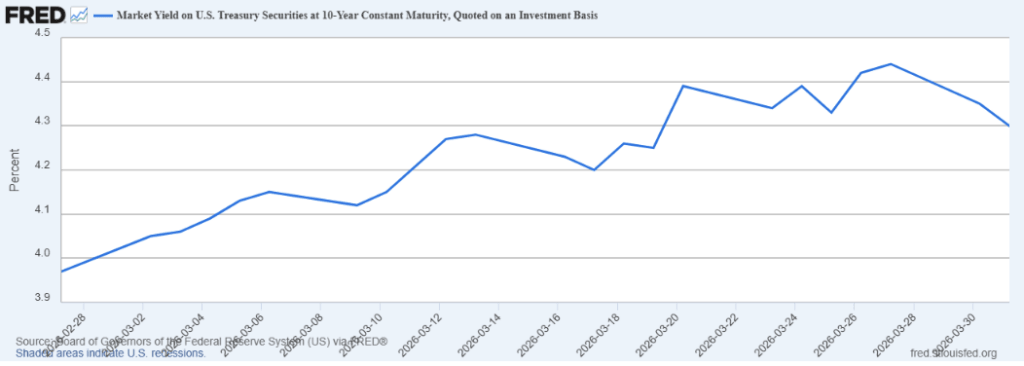
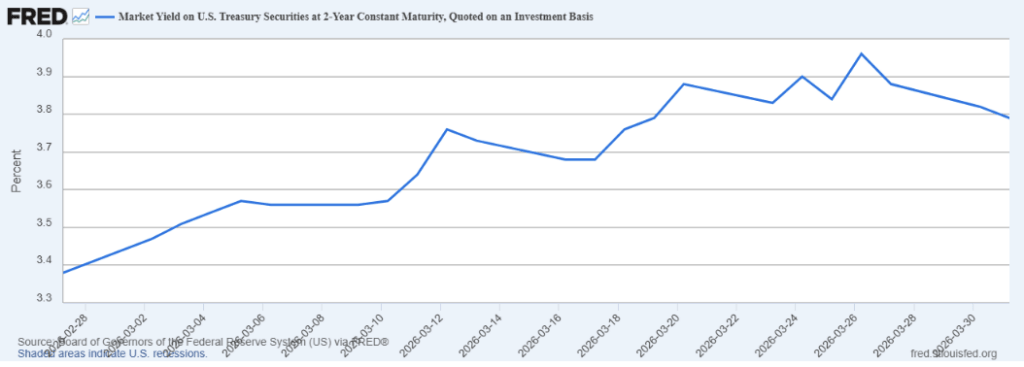
The benchmark 10-year Treasury yield rose nearly 40 basis points to around 4.4%, while
the 2-year yield climbed roughly 45 basis points, its largest monthly increase since
October 2024. As a result, bonds did not provide their typical diversification benefit.
Because the shock was inflationary, both equities and fixed income came under pressure
at the same time.
Commodities, led by oil, were the epicenter. Brent crude surged and remained firmly
above $100 per barrel, marking its largest monthly gain in decades. That move became
the defining cross-asset signal of the month, tightening financial conditions, pushing
yields higher, and challenging the assumption that central banks would be in a position to
ease policy in the near term. It also raised the likelihood that inflation data in the coming
months could reaccelerate after a period of relative stability.
Gold sent a more nuanced signal. While prices rebounded late in the month, the metal
was still on track to finish March lower, even as the U.S. dollar strengthened. That
combination highlights an important dynamic: in an energy-driven inflation shock,
traditional hedges do not always respond in a linear way. In March, oil, not gold, was the
asset that carried the clearest macro signal.
Exhibit 4: Cross-Asset Performance (March 2026)

Exhibit 5: U.S. 10-Year and 2-Year Treasury Yield (March 2026)
Economy and Policy
The Backward-Looking Data Stayed Calm, but Forward Risk Increased
The economic data released during March largely reflected a pre-shock environment, one
that was cooling, but still relatively stable.
Inflation remained contained heading into the month. February CPI showed prices rising
at a moderate pace, with core inflation still running slightly above headline levels but not
reaccelerating in a meaningful way. Similarly, January PCE (released with a delay) pointed
to a steady but not worsening inflation backdrop. Taken together, the data suggested that
disinflation progress had slowed, but had not reversed prior to the oil-driven move higher
in March.
Growth, however, was already losing momentum. The second estimate of fourth-quarter
GDP was revised down to a 0.7% annualized pace, reinforcing the idea that the economy
entered 2026 on softer footing than expected. Measures of underlying demand also
moderated, pointing to less resilience beneath the surface.
Labor market data told a similar story. Job openings held roughly steady, but hiring
slowed, suggesting a gradual cooling in labor demand. The March employment report,
released on April 3rd, showed payrolls rebounding modestly and the unemployment rate
holding near recent levels. While that was a constructive signal, it likely does not yet
reflect the full impact of March’s energy shock on hiring and business sentiment.
The key takeaway is that the data entering March did not point to an economy under
immediate stress. But it also did not leave much of a buffer. As the inflationary impulse
from higher energy prices is arriving at a time when growth is slowing, it may raise the
risk of a more challenging macro mix in the months ahead.
Key Dates to Watch in April 2026
Markets will be watching to see whether March’s energy spike starts to show up more
clearly in inflation, spending, and business sentiment data. The key U.S. dates are:
- April 9: Personal Income and Outlays (including PCE inflation) + Q4 GDP (third estimate)
- April 10: March CPI
- April 14: March PPI
The Bottom Line
March forced the market to confront a more complicated macro backdrop. The dominant
question is no longer just whether growth is slowing or whether a handful of crowded
trades have become overextended. It is whether the global economy is moving into a
period where softer growth and firmer inflation coexist for longer than investors expected
coming into the year.
That does not automatically mean a lasting regime shift is here. A meaningful
de-escalation in the Middle East and a reversal in oil could still ease pressure on rates and
inflation expectations. But March clearly raised the bar for risk assets and made the
macro path less forgiving. In the end, this was a month that reminded investors how
quickly geopolitical stress can become a market-wide repricing event.
Material prepared herein has been created for informational purposes only and should
not be considered investment advice or a recommendation from the Savvy Investment
Team. Information was obtained from sources believed to be reliable but was not verified
for accuracy.