The biggest news of the first quarter did not happen in the first quarter. It happened on April 2, just after the quarter ended. April 2, which was named, “Liberation Day” has turned into “Destabilization Day”. Since April 2, investors, business owners/executives, and leaders of countries are scrambling to figure out the impact of the new U.S. tariff policy. This effort has been complicated by the fact that the U.S. tariff policy has had several revisions since the initial announcement.
The current U.S. tariff policy is a base level 10% tariff on all countries with the higher, originally announced tariffs placed on hold for 90 days to provide time to negotiate trade agreements, intended to be more fair/favorable to the United States. The one exception to this policy is China, where the current tariff imposed by the U.S. on imports from China is 145% with China imposing a counter tariff of 125% on U.S. imports.
Markets initially reacted very negatively to the April 2 tariff announcement and have been volatile ever since. From April 2 through April 29, the absolute value of the average daily percent change in the major U.S. indices were 2.26% for the S&P 500 and 2.71% for the Nasdaq with a range of -5.97% to 9.52% for the S&P 500 and -5.97% to 12.16% for the Nasdaq. These wide swings in valuations from day to day are a good indication that people are not sure what the long-term impacts of the new U.S. tariff strategy will be. Some believe the tariffs are temporary and will be used as a tool to improve free trade between the U.S. and other countries while others believe the tariffs will create a global slowdown and overall price increases. Below is a chart of the VIX index which measures the level of volatility in the S&P 500 Index.

On April 8, this measure peaked at 52 and currently sits at around twenty-six. This elevated level of volatility is likely to remain until there is a clearer path forward on a resolution to the tariff negotiations the United States’ major trading partners and the trade war with China.
The U.S. Commerce Department recently released a report showing that U.S. GDP shrank by an annual rate of 0.3% compared to the previous quarter. The consensus expected growth of 0.8% for the first quarter, making the actual number 1.1 percentage points below expectations. This reduction occurred prior to the announcement on April 2 and is believed to be caused by businesses stockpiling imported goods ahead of the tariff announcement. The Components of GDP Chart by JP Morgan (shown below) provides the historical numbers on quarterly GDP growth for the U.S. The last negative reading was in Q1 of 2022.
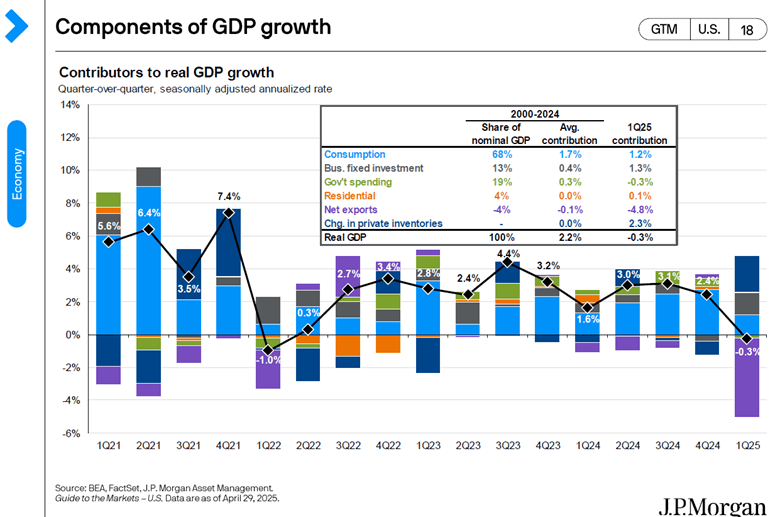
Current consensus estimates for full year GDP growth for calendar year 2025 are between 1.6% and 1.8% and are actively being revised as news is released. As an example of how quickly these forecasts can change, Goldman Sachs changed their forecast of U.S. GDP growth in 2025 from 2.5% in November, to calling for a recession shortly after Liberation Day to removing the call for a recession once the 90-day window was announced to a current estimate of 1.3%-1.5% growth. The point is that everyone is making their best guess and the longer the uncertainty continues the more likely it is that growth will slow as market participants wait for clarity to make decisions.
The International Monetary Fund (IMF) provided updated forecasts this month for GDP growth in individual countries. The below chart from JP Morgan shows the change in the IMF’s growth forecast from October 2024 through April 2025 for some of the largest trading partners with the United States. The gray bar shows how much the forecast was reduced, and the blue diamond shows the percent of that country’s GDP that comes from exports to the U.S.
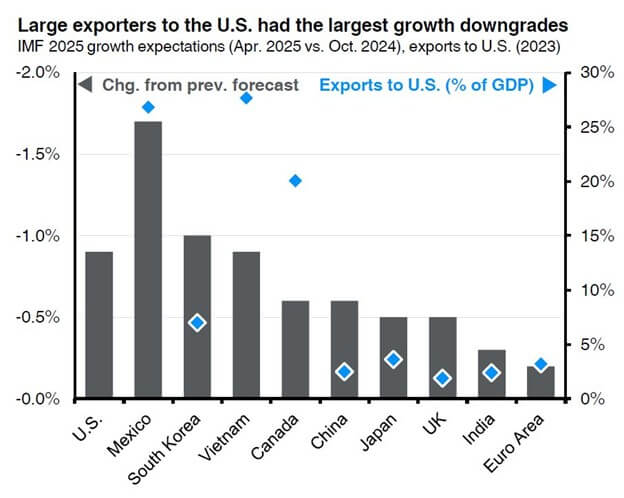
The following commentary for this chart was provided by JP Morgan, “The U.S. experienced one of the most significant growth downgrades since last October, from 2.7% to 1.8% in 2025. There were also large downward revisions for countries dependent on U.S. exports, such as Mexico (1.4% to -0.3%), South Korea (2.0% to 1.0%), Vietnam (6.1% to 5.2%), and Canada (2.0% to 1.4%). While domestic factors contributed to the downgrades as well, trade tensions and policy uncertainty were key considerations. Tariffs also offset the expected growth boost from positive changes in countries such as Japan (rising inflation and wages) and Germany (increased government spending).
Order frontloading might not be over, especially for products that remain exempt, which could keep some data points steady for longer. However, this summer could usher in significantly softer data and higher inflation. As the trade war continues, more market volatility is expected.”
Major U.S. Stock Indexes
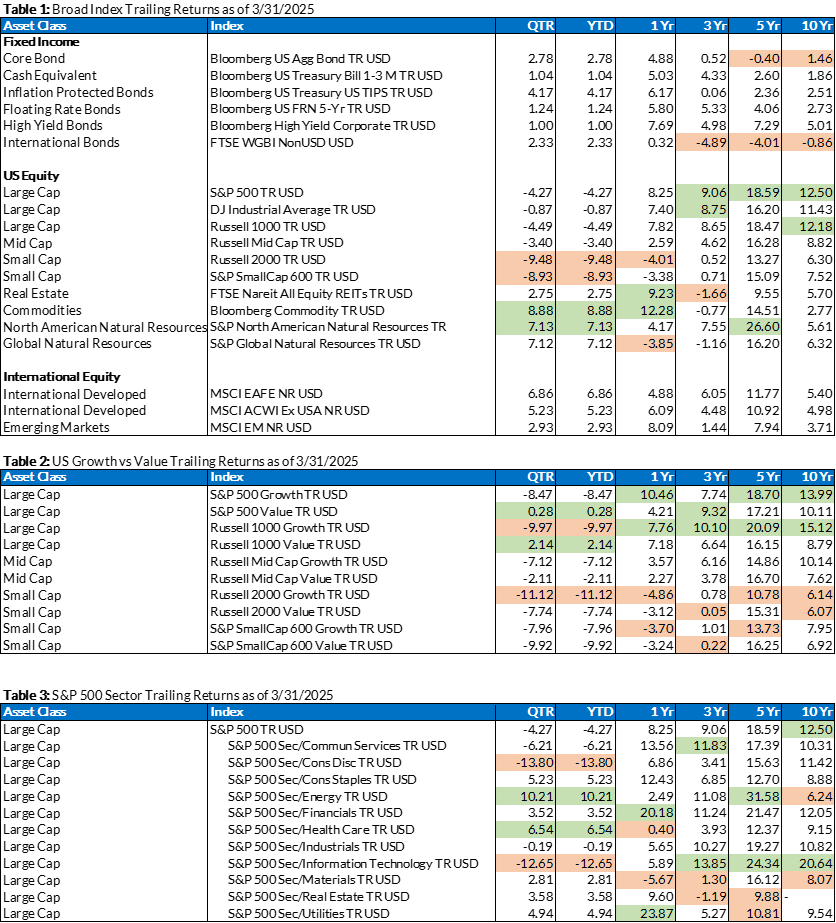
The table in the appendix shows the trailing returns for the major global indices as well as various sectors in the U.S. For the first three months of 2025, the Energy and Health Care Sectors had the best returns as investors sold off growth assets in favor of value. The S&P 500 declined by 4.27%, the Dow Jones Industrial Average decreased by 0.87%, and the Nasdaq 100 fell by 8.25%.
Inflation
We saw a bit of a mixed picture for inflation data in the first quarter:
Consumer Price Index – CPI readings showed mixed data in the first quarter, with consumer inflation climbing from December through February and then falling in March. The highest month-over-month CPI increase for Q1 occurred in February, which approximately aligned with the S&P 500 reaching its peak for the quarter.
The yearly CPI inflation rate was 2.8% in March’s reading, coming down from the 3.0% reading in February. The Fed’s long-term target inflation goal on an annual basis is 2.0%.
Producer Price Index – PPI data also appeared mixed in Q1. In February (March data release), the PPI for final demand demonstrated a year-over-year increase of 3.2%.
On the other hand, Core PPI, which excludes food and energy, experienced a slight decline of 0.1%, the first negative reading since July.
Labor Market / Payrolls
The U.S. labor market showed signs of cooling in the first quarter as tariff uncertainty tested its resilience.
Slowing Job Growth: While the labor market remained strong, job growth appears to be slowing, with the ADP Employment Report showing 62,000 jobs created in March compared to nonfarm payrolls increasing by 151,000 in February (March data release). This was less than expected, following a downwardly revised 125,000 gain in January.
Fed, Rate Cut Probabilities
- The overnight lending rate set by the Fed remained unchanged during the first three months of 2025. The January Federal Reserve meeting minutes revealed concerns about tariffs’ potential impact on inflation, leading to a cautious stance on rate cuts.
- In the first quarter, the Fed lowered its 2025 economic growth forecast while raising its inflation projection. They maintained a “wait and see” approach amid tariff uncertainties, projecting two rate cuts in 2025 despite facing a more uncertain economic environment.
- At the close of the final trading day of Q1, probabilities showed an 85.5% chance for rates remaining unchanged at the May Fed meeting.
- Looking beyond May, the futures markets suggest a 64.3% chance of a quarter-point rate cut in June (data current as of market close on March 31st). Some analysts are eyeing July and perhaps several cuts.
Unhappy Consumers
Consumers are increasingly hesitant in the current environment. They have been through a lot over the years and perhaps have reached an inflection point.
- In Q1 2025, U.S. consumer health metrics deteriorated significantly. The Conference Board Consumer Confidence Index fell from 104.1 in January to 92.9 in March, with the Expectations Index dropping to 65.2 — well below the recession threshold of 80 — indicating growing pessimism about the future.
- The University of Michigan Consumer Sentiment Index also declined sharply to 57.0 in March, down 11.9% from February, driven by inflation fears with 1-year expectations at 5.0%.
Summary
While there is a lot to be cautious about, market sentiment has come down from the extreme fear end of the spectrum and we feel the outlook is still favorable for long-term investors. These past few months have been eventful with significant uncertainty primarily due to the tariffs. Given this, it is helpful to remember that markets absorb events and changes, such as the pandemic and inflation spikes and the market corrections from these events can create opportunities for new investment.
Index Trailing Returns
Source: Morningstar
(Green values are the top two values in each column; the orange values are the bottom two values in each column for each table)