We hope your 2025 is off to a great start. So much has happened since our last quarterly update: the Israel Hamas war has reached a ceasefire, the S&P 500 performed well, Donald Trump was re-elected to President of the United States, the U.S. Federal Reserve lowered the Fed Funds rate two times, and Wicked, the movie, was released :). 2024 was a strong year for stocks, especially large cap U.S. stocks with many long-term investors enjoying positive gains.
As we look forward to 2025, there is much to consider including current stock market valuations both in the U.S. and abroad, the narrowness of the market rise with a few companies accounting for much of the increase and whether the rally will broaden, the outlook on inflation and the impact that U.S. Tariffs and spending cuts could have on inflation, the possibility of various wars and conflicts ending or escalating, and so much more.
This update provides a brief recap of 2024 and a look ahead at 2025.
2024 U.S. Equities Picture
2024 was a predominantly smooth year, with some short-lived periods of volatility courtesy of the Japanese Yen, some concerns about economic growth over the summer, and more recently, there was a quick surge in volatility in December on a less rate-cut-friendly sounding Fed going into 2025.
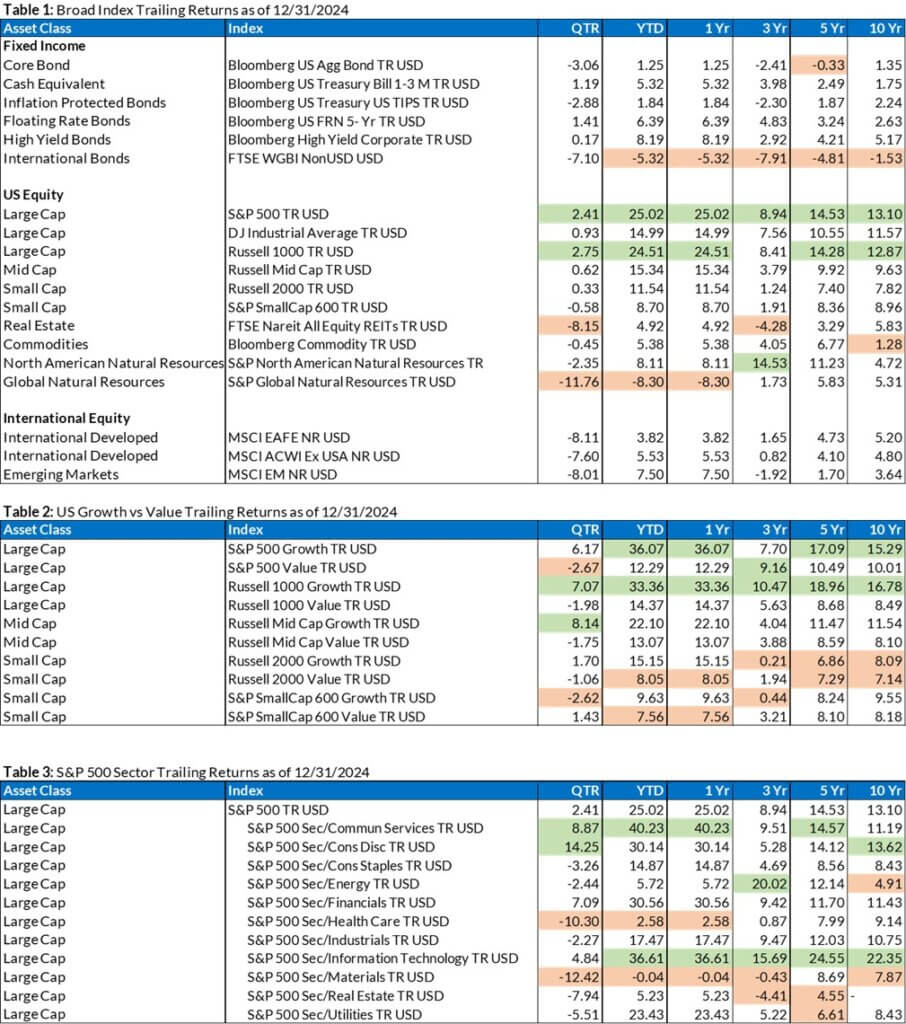
In spite of the volatility, 2024 was another good year for equities. The S&P 500 posted a calendar year return of 25.02%, the Nasdaq 100 rose by 25.58%, and the Dow Jones Industrial Average was higher by 14.99%. As shown on the tables at the end of this update, growth outperformed value for the year and the Communications and Technology Industries were the sectors with the highest returns while Health Care and Materials had the lowest return for the year.
After two strong years of returns for U.S. large cap equities, that were in large part driven by technology companies based on optimism and spending on artificial intelligence (AI), valuations are now at similar levels to 2021.
The S&P 500 valuation measures chart provides a historical view on valuation back to 1994. This chart looks at the price that is being paid to buy companies in the S&P 500 divided by the expected earnings over the next 12 months. As of the end of 2024, this metric is 21.5x with the 30-year average being 16.9x. The question is whether this valuation can be maintained or if it needs to come down. There are two ways for this valuation to be reduced closer to its 30-year average, either the earnings of the companies in the S&P 500 increase enough to justify the price that is being paid or the price drops.

2024: Magnificent 7 Rally, Further Broadening in 2025?
In 2024 the returns in the S&P 500 were still highly concentrated. The 7 large technology companies that people refer to as the “Magnificent 7” accounted for 57% of gains in the Index and in 2023, they accounted for 65% of the gain. This is unusual for so few companies to make up such a large part of the gain in an index as broad as the S&P 500 especially when the index has had the level of returns that it has.
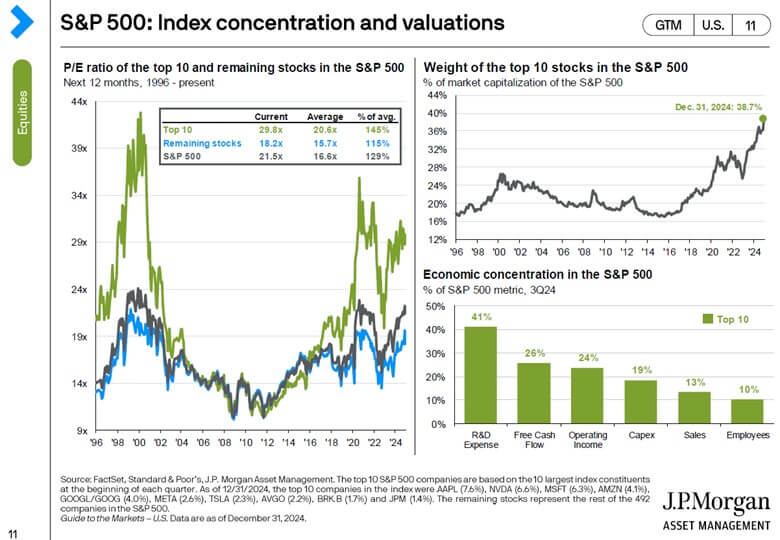
The question is whether 2025 will see some broadening of the returns to other companies and other sectors. The below table lists out the top ten companies by weight in the S&P 500 Index. The Magnificent 7 are included in this list. The chart following the table entitled, “S&P 500: Index concentrations and valuations”, shows the historical weighting that the top 10 companies at the time (not necessarily these companies but whichever companies made up the top 10) have had going back to 1996. The current weighting of around 39% is the highest it has been over the time period shown on the chart. The chart also shows that the valuation of the top 10 companies is much higher than the valuations of the other 490 companies in the index relative to their earnings.
These higher valuations and the higher concentration is justified by many due to the earnings growth of these companies. The chart entitled, “Why Big Tech Keeps Outperforming Everything Else” shows that the earnings for these companies keep getting revised upwards as they keep exceeding expectations.


With the total value of these companies exceeding $3 Trillion and annual revenues in the hundreds of billions, it seems that at some point they won’t be able to maintain the same level of earnings growth. Once the earnings growth slows, the price per unit of earnings will reduce. The question is will the earnings have grown enough to keep the prices at or above where they are. Further, we have seen recently how the effect that unexpected news, such as with the emergence of DeepSeek (China’s lower-cost artificial intelligence model) on Nvidia’s and semiconductor stock price declines, can more rapidly effect concentrated stock positions than more diversified portfolios.
Consumer Inflation
Government data shows that consumer inflation, as measured by the Consumer Price Index (CPI), had an overall decline in 2024 (hence the recent rate cuts). However, recent readings remain sticky, and the “last mile” to get the Fed’s 2% annual target is taking some time.
Shelter pricing has remained stubborn overall, although recently, shelter prices have shown some preliminary signs of accelerating at a slower pace. Gasoline prices in the U.S. have fallen steadily in recent months, with expectations for expedited production permitting from the new administration.
Energy prices can be volatile (along with food) and impact consumer pricing readings, so many analysts look to Core CPI for data that is “smoother.” Core CPI is running higher by 3.3% compared to one year ago, according to November data released in December.
The “Inflation components” chart shown below shows the portion of current and past inflation that is caused by various goods and services. Shelter makes up the largest portion of the inflation number with core goods and energy actually showing price decreases.

With Donald Trump being elected to President of the United States, there is concern that his tariff policy could contribute to inflation on various goods and services. The below graph shows an estimated range of tariffs based on proposals that President Trump offered while he was running for office. It also shows how these proposals compare to past tariff levels going all the way back to the 1700s. Our view is that President Trump is using tariffs to negotiate better terms for the United States with its trading partners and to enforce the observance of fair-trade policies. If tariffs are enacted at a significant level, there is some risk that tariffs could cause inflation to remain high although some economists believe that the impact on inflation will be temporary in that it will cause a bump up in prices that will not continue to grow over time.

Another concern with the tariffs is the impact it could have on companies outside the United States. The “International valuations” chart below shows how far below average the international valuations are compared to the U.S. valuations. Currently a dollar of earnings in an international company is work around 13x whereas a dollar of earnings in the U.S. is worth around 21.5x. Historically, U.S. earnings have been worth more than international but not by this much. While we don’t view this as a sign that we should significantly overweight the international allocation in your portfolio, we do see it as a good reason to maintain an allocation to international stocks.

Fed Tone Shift / Outlook
The Fed had broadcast four cuts to come in 2025 at the September meeting, and the current message is that there will only be two.
So now, markets will want to see inflation and unemployment continue to decline to get excited about Fed rate cuts again. In the meantime, perhaps the concentrated rally of 2024 will find its way to broadening somewhat.
Let’s not forget that market expectations at the beginning of 2024 had a total of six to seven quarter-point rate cuts priced into markets. At that time, the Fed had broadcasted a message of only three quarter-point cuts to come in 2024.
Well, in the end, we got what the Fed said as far as the number of cuts, although one of them was a cut of 50 basis points.
The Takeaway
2024 was another banner year for U.S. equities, with long-term investors being rewarded heavily for the second consecutive year.
As we move into 2025, the future market performance and inflation picture will be interesting to watch as market participants weigh the impact of a potentially stronger U.S. economy fueled by a pro-U.S. growth administration with fewer regulations, against the impact of tariffs, and potentially higher commodity prices.
As for interest rates and the labor market, the Federal Reserve has stated there will be fewer rate cuts in 2025 and the labor market has cooled somewhat while remaining resilient.
We hope that you find this review and outlook informative in understanding the current expectations of broad market participants. Thank you for your trust in working with Blue Barn Wealth.
Index Trailing Returns
Source: Morningstar
(Green values are the top two values in each column; the orange values are the bottom two values in each column for each table)
