The S&P 500, which is the broadest measure of the U.S. equity markets, just completed its fourth positive quarter in a row, with seven out of the last eight quarters yielding positive returns. Long-term investors have been rewarded over this time with a recovery from the sell off from the market high in November 2021. Looking forward, the presidential election in the United States in two weeks as well as the recent and likely future rate cuts by the Federal Reserve present market uncertainty. This update reviews the highlights of this past quarter as well as provides some long-term perspective on how markets have been impacted by U.S. election outcomes and interest rate cutting cycles.
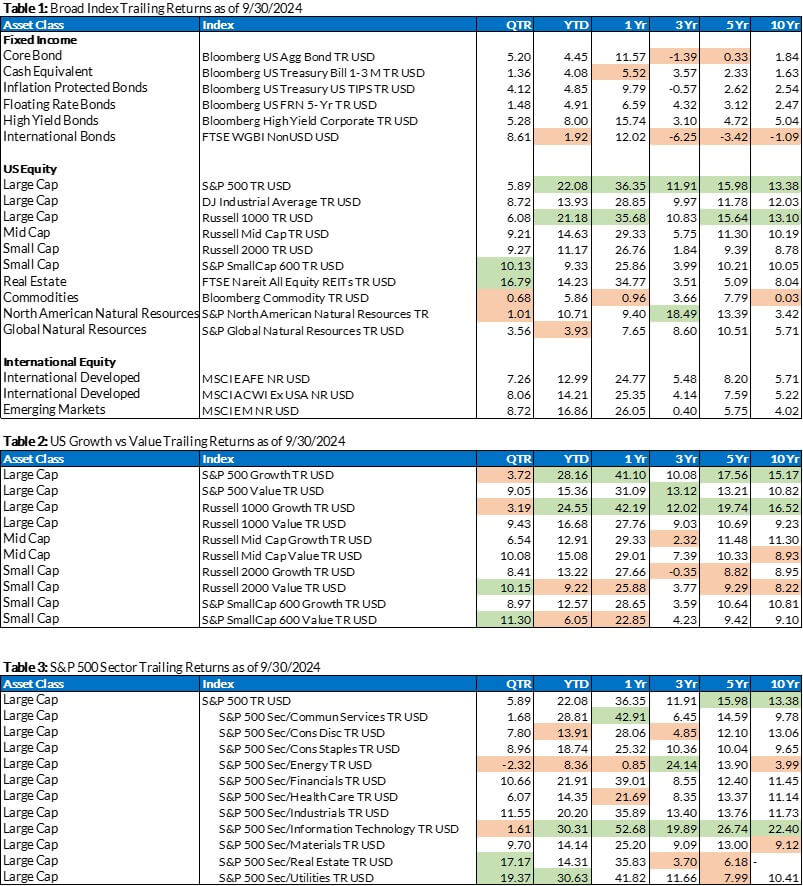
In the face of headlines and widespread concern about inflation, high interest rates, government shutdowns, wars and more, the broader equity indexes have continued to climb. For the third quarter of 2024, the S&P 500 increased by 5.89%, the Dow Jones Industrial Average jumped by 8.72%, and International Developed Index increased by 7.26%. Real Estate and Utilities were the two sectors with the highest returns for the quarter (see the Index Trailing Return tables at the end of this update).
Broad Economy
One of the primary drivers for this quarter’s positive returns was the 0.50% interest rate cut by the U.S. Federal Reserve. This interest rate cut was made possible by the declining inflation rate and weakening unemployment rate even though unemployment remains relatively low. The U.S. Federal Reserve is trying to proactively cut rates before the labor market softens too much. In their September meeting minutes the higher than expected unemployment rate was one of the key reasons cited for lowering the Fed Funds Rate by as much as they did. In the meeting minutes, they stated “that labor market conditions had eased further in recent months and that, after being overheated in recent years, the labor market was now less tight than it had been just before the pandemic. As evidence, participants cited the slowdown in payroll employment growth and the uptick in the unemployment rate in the two employment reports received since the Committee’s July meeting, lower readings on hiring and job vacancies, reduced quits and job-finding rates, and widespread reports from business contacts of less difficulty in hiring workers.”
Other countries/regions have also cut interest rates. The European Central Bank has cut interest rates three times since June. In addition, 7 other countries listed on the Trading Economics website ( https://tradingeconomics.com/country-list/interest-rate) lowered rates in September or October.
Thus, the global rate hike cycle appears to be over, and central banks are now trying to determine how quickly and by how much to lower rates to avoid sustained economic slowdowns without reigniting inflation concerns. In the U.S., inflation is approaching the Fed’s 2% target rate whereas in the Eurozone the inflation rate has dropped below the target rate. The expectation is that the reduced interest rates will allow the labor market to remain strong and at or close to full employment while keeping the inflation rate at the target level. It is important to note that this strategy does not attempt to drive prices back down to their levels prior to the run up over the past few years but rather to keep the prices where they are and allow them to increase from here at the target rate.
The impact of these decisions on interest rates, monetary policy, and fiscal policy take years to play out. So, it remains to be seen whether the recent interest rate reductions will be enough to offset the intentional slowdown created by the interest rate increases. A recession remains a possibility.
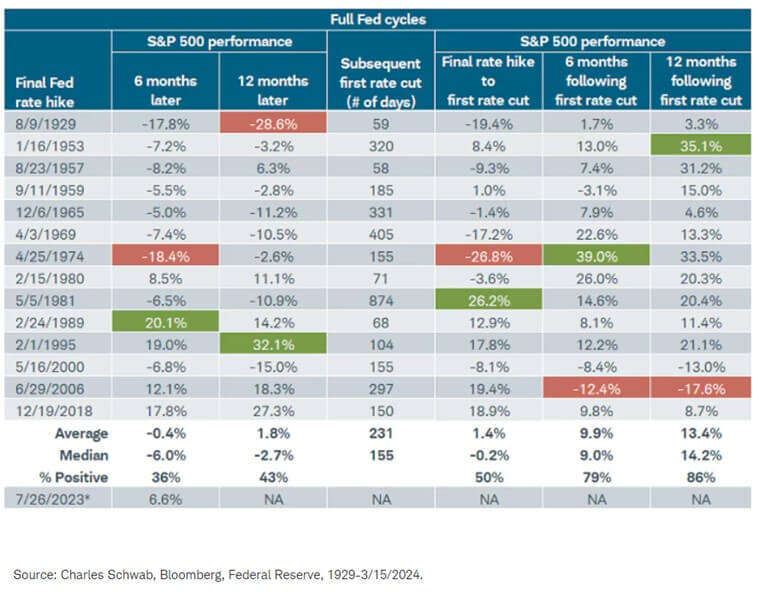
With the U.S. beginning the rate cutting cycle in September, the below table may provide some helpful context on how markets have behaved in past rate cutting cycles. This table, from Charles Schwab, Bloomberg and the Federal Reserve, goes back to 1929 and shows the stock market performance 6 and 12 months after the final rate hike in a cycle as well as how long it then took for the first rate cut. It also shows the rates of return between the final rate hike and the rate cut and the returns 6 and 12 months after the first rate cut. The average return of the S&P 500 over the 6 and 12 months following a rate cut is 9.9% and 13.4% respectively with a positive return occurring 86% of the time. Only 2 times (2000 and 2006) were the returns negative 12 months after the first rate cut in a cycle.

Inflation Softer for Third Quarter
The Consumer Price Index in June, which was released in July, actually fell on a monthly basis, with data showing a 0.1% monthly decrease from May. This was 0.2% lower than the Dow Jones estimate of a 0.1% monthly increase.
The July Consumer Price Index data showed continued cooling for the month, with the annual inflation rate slowing to 2.9%. For August, the Consumer Price Index data revealed a 0.2% increase in monthly CPI, resulting in an annual increase of 2.5%. This is the lowest annual inflation rate since 2021 and a 0.4% decline from the previous month. These data releases helped cement the inflation-cooling theme which gave the Federal Reserve the freedom to lower short-term interest rates.
August Volatility Spike
While the quarter was positive yet again, it wasn’t without some volatility. In early August, the VIX Index, which is a measure of volatility that is normally under 20, spiked above 60 before settling back under 20 a few days later. This volatility spike was very abnormal and was driven at least partially by traders trying to unwind what is known as the Japanese Yen carry trade.
The Japanese Yen carry trade is where traders borrow money in Japan with their low interest rate then invest those funds in another market where they expect to receive a higher return. With Japan raising their interest rate, it made borrowing more expensive and caused many to try to undo their trade at the same time. This caused volatility to spike. The effects were felt worldwide but were short-lived.
Labor Market Concerns
Labor market concerns popped up in a big way in the third quarter. There were substantial revisions to previously reported labor market data to the tune of 818,000 jobs revised downward over the preceding 12-month period.
Looking at the three nonfarm payroll prints during Q3, we see:
- 206,000 jobs were created in June, in line with estimates, but this is when downward revisions began to the tune of 111,000 downward revisions in April and May.
- 114,000 jobs were created in July vs. 185,000 forecasted, a sharp slowdown from June data. Unemployment increased to 4.3%, indicating additional slowdown in the labor market as a whole.
- 142,000 jobs were created in August vs. 161,000 forecasted. There was a notable spike in unemployment.
Early September Volatility
In response, there was some more market volatility in early September, but this pessimism was short-lived. The Fed cut rates by 50 basis points, and the worries faded to black in the eyes of major stock indexes again — at least for now.
Labor market concerns are valid, especially when factoring in the revisions to previously reported labor market data. But we’ll see if the medium-term effects of the rate cut result in some strengthening of the employment markets in the fourth quarter.
Could the rate cut result in a pickup in inflation that everyone is feeling is in the rear-view mirror? It’s possible — we will see if the Fed can thread this narrow needle.
Fed Outlook
At the end of third quarter, markets were pricing in a 64.7% probability of a 25-basis-point cut and a 35.3% chance of a 50-basis-point cut at the November meeting, per the CME FedWatch Tool.
There is a general consensus of 50 basis points of further rate cuts in 2024, as suggested by Federal Reserve Chair Jerome Powell himself at a September 30th conference at the National Association for Business Economics.
Remember, however, that the Fed is heavily data-dependent, so additional CPI prints will be considered.
Treasury Yield Normalization
After being inverted for the longest period in history (793 days), the 2/10 yield curve finally uninverted/normalized in September. This means that the 10-year yield is once again higher than the 2-year yield. The 2/10 yield curve normalization has various interpretations, one of which is that it’s a historical indicator of recession. Now that it is no longer inverted, it may indicate that a recession is less likely.
Moving Forward
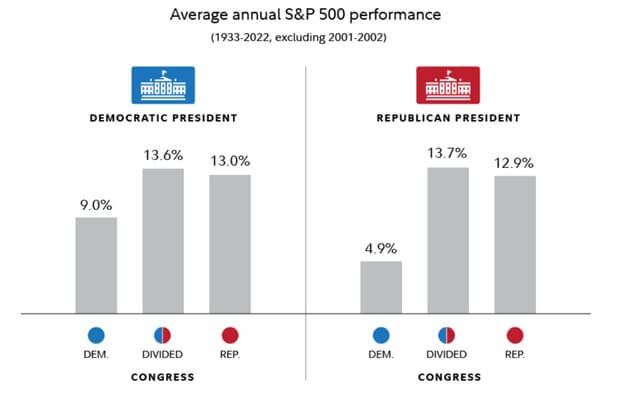
The fourth quarter is usually a good one. But it is still a highly Fed-centric market, with an impending election in the United States, there will be no shortage of headlines and narratives. For those of us who are concerned about the impact the election will have on financial markets, we have included two charts below that will hopefully provide some perspective.
The first chart shows the average annual return of the S&P 500 from 1933 through 2022 split out by which party held the presidency and then further split by whether the congress was divided or controlled by the Republican or Democratic party. Interestingly, the chart shows that the returns are best when there is a divided congress, independent of which party is in the White House. The average annual return of the S&P 500 with a divided congress has been around 13.6% whether a Democrat or Republican was president.

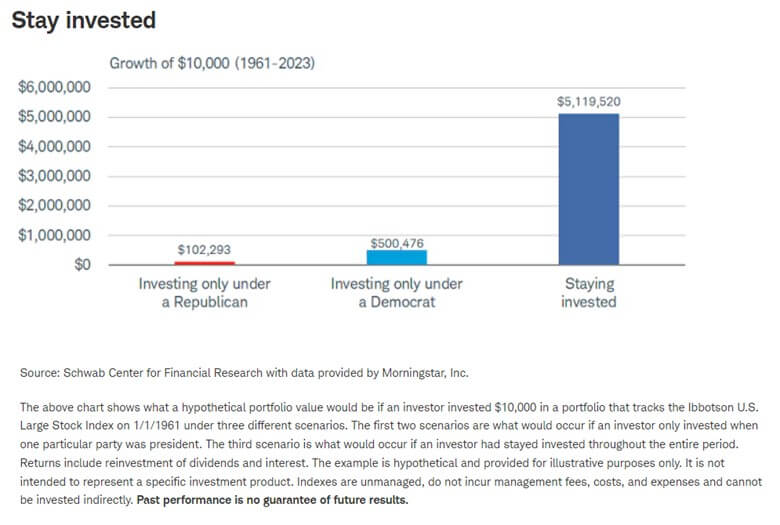
The second chart shows the impact on overall investment returns of not staying invested over time. The chart shows the growth of an investment of $10k from 1961 through 2023. For those who invested the $10k and stayed invested throughout the 60-year period, the average annual return was around 10.6% and the investment would have grown to over $5M. Whereas, if an investor chose to only invest while one of the two political parties was President of the United States, the long-term returns would have been much lower.
Hopefully, these two charts provide some perspective on the fact that while your policies and ideologies may align better with one political party than the other, historically, it has been better to remain invested regardless of who is in power at the time. If headlines dictated market performance, long-term investors wouldn’t be in the position they are in today, as headlines over the last couple of years have been quite negative.
As long-term investors, we believe it is best to look beyond the short-term news cycles and intimidating headlines.

Please reach out to us if you have any questions about this market update or your financial plan. As always, we truly appreciate the opportunity to serve you.
Index Trailing Returns
Source: Morningstar
(Green values are the top two values in each column; the orange values are the bottom two values in each column for each table)
