If all you knew of the most recent quarter was the returns shown in the tables provided at the end of this update, you may think it was a mild quarter with only a 3-4% pullback in most major indices. While accurate, this misses some of the roller coaster experience we have had. Because markets had such strong returns in July, the first month of the quarter, the actual drop from the highs experienced at the end of July through the rest of the quarter and through October was much larger than 3%. Many indices dropped by over 10%, which is considered a “correction.” Last week provided some reprieve from the fall as we headed into November, which has historically been the best month for stock market returns.
S&P 500: A Breather After Three Straight Positive Quarters
Overall, stock market bulls were on the retreat during the third quarter of 2023 as several major stock indexes traded lower in response to rising interest rates and a strong dollar.
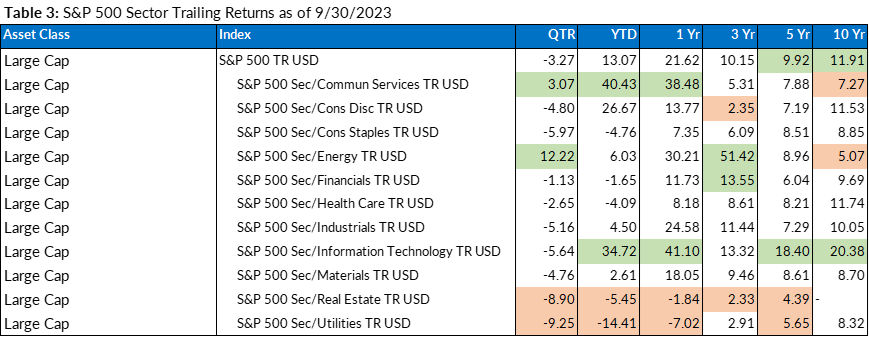
In fact, after three consecutive positive quarters for the S&P 500, the large-cap index found some sellers in the third quarter. Utilities and real estate contributed to the selling, while the energy sector surged.
Economy: Soft or Hard Landing?
Rising interest rates and stubborn inflation remain front and center. The Federal Reserve has clearly communicated its “higher for longer” expectations on interest rates, and the message is starting to sink into the markets.
A recession induced by a rate-hiking Fed and lingering inflation is still a possibility. Interest rates rose steadily across various durations and products throughout the quarter, and a tighter lending environment is a factor in the financial markets.
Inflation Mixed for Quarter, Ticks Higher
Inflation metrics were mixed in the third quarter, with consumer inflation reversing its previous downward trend and picking up in August and September data releases.
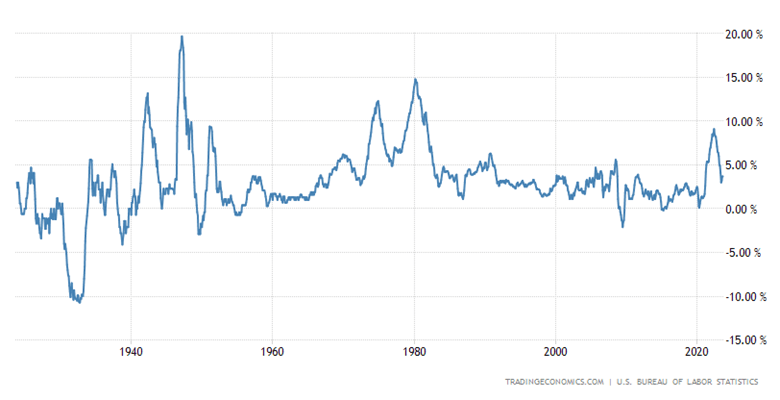
The last Consumer Price Index (CPI) release of the quarter showed a 3.7% rise year-over-year in August versus 3.6 % expected. This was much higher than the 3.2% rise year-over-year in July. The recent uptick in headline consumer inflation helps to support the higher-for-longer interest rate narrative that the Fed is broadcasting. To provide some perspective, Chart 1 shows CPI by month for the past 11 months, and Chart 2 shows CPI going back to the 1930s.
Core CPI (which removes volatile food and energy) ran a little hot in August but remains in its downtrend for 2023, providing a mixed theme on inflation.
Chart 1: Year over year inflation readings 11/2022 – 09/2023

Chart 2: Year over year inflation 1930 through 2023
Labor Market: Goldilocks?
Labor market resilience persisted throughout the third quarter, with solid payroll gains (187,000 in August, 187,000 in July, and 209,000 in June). Two out of those three numbers missed analyst consensus expectations, but not by much.
Some analysts call it the perfect labor market for the Fed, even goldilocks-like, as a gradual cooling is noted, yet with continued strength. A continuation of this pattern in employment data could help to cool the Fed’s rate-hiking.
The unemployment rate also showed a mixed picture for the third quarter, but there was a notable spike in unemployment in the last monthly data release of the quarter.
Fed Summary & Outlook
The third quarter featured two Federal Reserve meetings, with the Fed raising rates by 25 basis points in July and leaving rates unchanged at the September meeting. The result is a current target overnight lending rate of 5.25 – 5.50%, a 22-year high.
While the Fed also left rates unchanged at the most recent November meeting, it did let us know that policy could remain “restrictive.” The Fed also indicated it would need to see more evidence that inflation is under control for these restrictive levels to be changed.
As of this writing, markets were pricing a 90.4% probability of no hike in December (9.6% chance of a 25-basis-point hike), per the CME FedWatch Tool.
How High Will Rates Go?
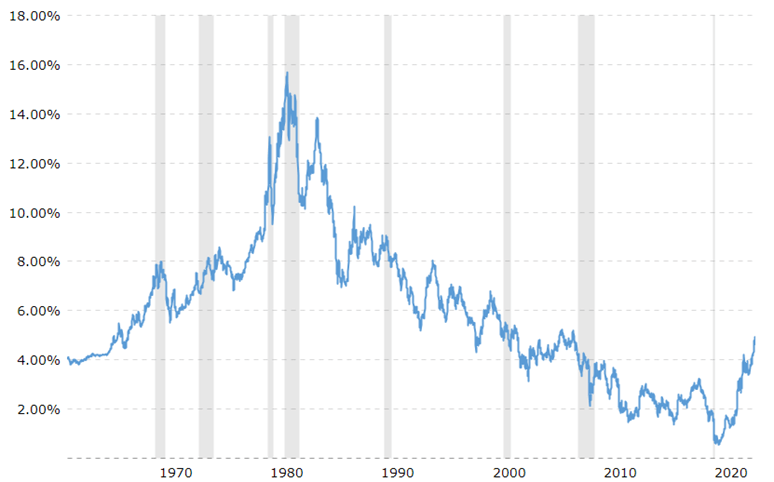
At the close of the third quarter, the interest rate-corresponding 10-year Treasury note yield sat near 4.57%, which is significantly higher than it has been in recent years. However, to keep things in perspective, the 10-year Treasury note traded above 5.06% from 1967 to 1998. It spent 31 straight years above that threshold, and it actually reached highs north of 15% in 1981, as can be seen in Chart 3. So, there is precedence for interest rates to be well higher than they are today. Based on recent comments by the Federal Reserve and declining inflation, we don’t expect that rates will rise too much above current levels.
Chart 3: Ten Year Treasury Note 1950 through 2023
Looking Ahead
It was an eventful quarter in the financial markets, and it is still a highly Fed-centric market, with any clues presented by labor and inflation data being front-and-center.
The good news is that the fourth quarter is historically the best quarter for stocks, with November being the best month for stocks, as shown in Chart 4. Time will tell if that pattern holds true this year.
Fluctuations in market prices and investor sentiment like those we have just experienced are part of investing in publicly traded markets where assets are valued daily. We realize this can be stressful and welcome any questions you may have. We also know the value of focusing on the long-term and being intentional about accomplishing those goals that are most meaningful to you.
Chart 4: Average Monthly Performance and Percentage of Positive Monthly Returns Since 1950

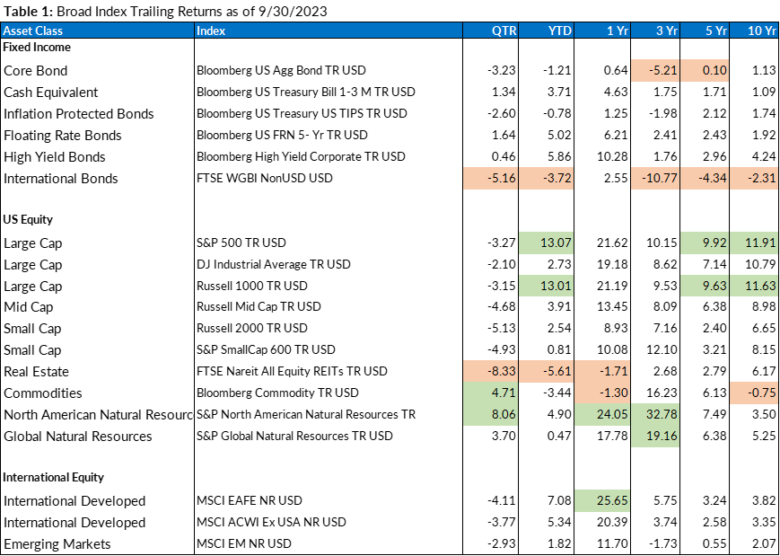
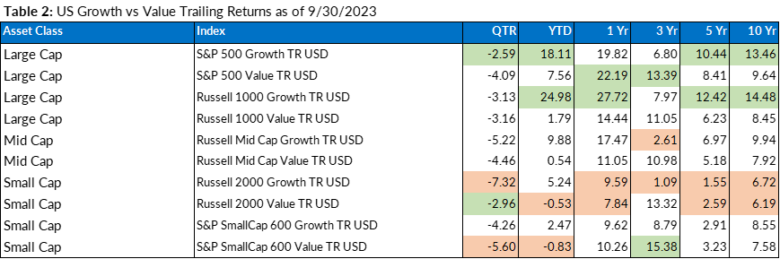
Index Trailing Returns
Source: Morningstar
(Green values are the top two values in each column; the orange values are the bottom two values in each column for each table)