Intra Quarter Market Update
Given the recent drop in values across most financial markets, we are providing a market update prior to quarter end. We hope this content will offer some perspective on what we are experiencing and help you not only get through this stressful time but hopefully take advantage of the opportunities that are available.
The S&P 500 index, a broad measure of the U.S. Stock Market, officially entered bear market territory on Monday of last week when it closed the day down 21% from its most recent all-time high on January 3, 2022. In addition, the Nasdaq was down 31%, the Dow Jones Industrial Index was down 16.5%, and Developed International Indices were down around 24% from January 3rd on the same Monday of last week.
Since 1950, this marks the 11th bear market for the S&P 500, which is defined as a drop of 20% or more from an all-time market high. As the S&P 500 is now in bear market territory, we thought it would be helpful to review what happened the 10 prior times the S&P 500 had a drop of this magnitude or more. Please keep in mind that only a portion of your individual portfolio may be allocated to investments similar to the S&P 500 with the rest of your portfolio allocated more or less conservatively. Thus, the return on your portfolio may be different than what is discussed here.
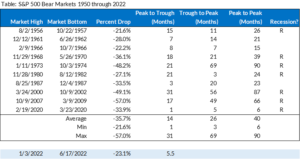
The above table lists information for every drop in the S&P 500 of 20% or more since 1950. While there have been several times the S&P 500 has dropped close to 20% (such as 2018, 2011, and 1990), we are limiting the data to those instances in which the drop was at least 20%. Over the past 72 years, a bear market has occurred every 6.5 years on average, with the longest period between bear markets being 12.6 years and the shortest being our current situation in which only 1.9 years had passed since the beginning of the 33% drop due to the COVID pandemic.
As shown in the table, the number of months it has taken the market to drop from its all-time high to the low point has ranged from 1 month to 31 months with the average drop from peak to trough lasting 14 months. As of today, almost 6 months has passed since the most recent all time high on January 3, 2022. The data also shows that the total loss in value during bear markets has ranged from 21% to 57% with an average drop of 36%. The loss in the S&P 500 for the current bear market is around 23%, so to get to the average loss of 36%, we would need to experience an additional loss of 13% off the all-time high. It may be worth noting that only 3 of the 10 prior bear markets since 1950 had drops greater than the average. These three were the 1973 oil embargo and gold standard recession, the dot com bust, and the great recession in 2007.
As for the time it takes to recover from a bear market, the table shows that from the low point, it has taken anywhere from 3 months to 69 months to fully recover, with an average time of 26 months. Combining the full cycle from the date of the all-time high peak prior to the bear market until the market regains its peak, the time has ranged from 6 to 90 months, with the average duration being 40 months. Lastly, the table shows that 7 out of the 10 prior bear markets dating back to 1950, coincided with a recession. With the stock market often moving prior to economic variables, it is likely the U.S. has already entered into a recession that will be confirmed with 2 consecutive quarters of the economy shrinking in size.
We do not know how long the current bear market, or its recovery will last. However, as we have seen in the past, we expect that values will fully recover and once again reach new all-time highs. As such, we see the reduced prices as an opportunity to buy assets at meaningfully lower prices than were available 6 months ago. Various suggestions for how to benefit from the current reduction in prices are made below, after a brief discussion of the factors causing the current sell off and various catalysts that might help assets stop losing value.
Earlier this month, the Bureau of Labor Statistics published the year over year change in the Consumer Price Index (CPI), which is a common measure of inflation. For May, the CPI was 8.6%, which set a new high for the past 40 years and was an increase over recent months. Some market participants had assumed inflation had peaked and would start dropping rather than continuing to increase, so when the May CPI came back higher than expected, it created significant concern leading to a drop of over 10% in the S&P 500 in one week.
Why is higher than expected inflation such a big concern? Primarily due to two reasons. The first is that one of the only ways to stop inflation once it starts is to raise interest rates. These rate increases cause the cost of financing to increase and can lower the demand for large purchases such as cars, homes, new buildings, equipment, etc. Reducing the demand for these items typically causes the overall economy to slow down. If the economy slows down too much with individuals and businesses no longer purchasing various items, businesses have to start reducing their workforces, thereby raising unemployment. Although some slowing down of the economy is necessary to get inflation back down to the target level of 2% per year, the current concern is that any attempt to slow the economy could inadvertently cause things to slow too much and start a negative cycle of increased unemployment, lower profits for companies, and slower overall growth.
The second reason is that companies are valued based on future cash flows/profits they expect to receive that are discounted back to the present value. As interest rates rise, the interest rate used to discount future cash flows back to today are higher, thus making those future cash flows less valuable. As a result, those companies are worth less than when interest rates were lower, which is why many of the large technology and other growth-oriented companies have lost so much value over the past 6 months.
In addition, higher interest rates cause the value of existing fixed income instruments such as bonds to go down in value. The United States 10-year Treasury Note yield was at 1.63% on January 3rd, and as of last week, it was at 3.25%. This doubling of the primary benchmark interest rate has negatively impacted what are normally more stable bond prices, causing most aspects of standard portfolios to lose value.
So, what needs to happen to reverse the downward trend in asset values? Inflation needs to be brought under control, and interest rates need to reach an equilibrium point. The Federal Reserve announced last week that it was raising the short-term overnight rate by 0.75%. They were only planning to raise the rate by 0.50%, but the inflation reading from the prior week caused them to be more aggressive. The Fed is trying to raise rates in an orderly but urgent way to get inflation under control. A solution also needs to be implemented for energy prices. Current global events and domestic energy policy have caused gasoline prices to more than double over the past year and a half. Some companies are starting to reduce their workforces due to the current environment, and it is expected that more will follow. If inflation can be tamed and interest rates reach an equilibrium without mass layoffs, we could see a recovery from this bear market in a shorter than average period of time. However, if inflation continues at the current level or higher and interest rates must be raised as high as they were in the early 1980s, the length of the recovery could be much longer.
How do we take advantage of this opportunity? Bear markets create an opportunity where quality assets go on sale and are available at significantly lower prices than before the sell off. While this doesn’t help the money you have already invested in the assets that dropped in value, it does provide a chance to make some changes that can benefit you as the values recover. Below is a list of strategies that we will consider implementing on your behalf and invite you to reach out to us with questions or other ideas you may have. We want to be proactive to do what we can to take control of what we can.
- Rebalance your portfolio where needed. This may mean that we replace some investments in your portfolio with other investments that have now become attractively priced so that we can take advantage of compelling valuations. It may also be that we trim those investments that have relatively held up in value and buy more of those that have dropped the most as they are likely to gain the most when things recover.
- Tax loss harvest. Even if we have already done so in the past few months, we may consider harvesting again. By intentionally booking losses today, you’ll be able to roll those losses into the future to offset gains in the next bull market. This can be a fantastic way to take advantage of these selloffs and lower your tax bill in the future.
- Don’t try to time the market. Studies abound that almost nobody can get the timing right. Even if someone is correct that the market is going lower in the short-term, the likelihood of getting both the exit and re-entry timed correctly is close to zero. Even the best traders in the world struggle with this endeavor.
- Sell “down to the sleeping point” if you need. We generally don’t recommend that clients make drastic changes to their target asset allocation during a sell off like this, since doing so likely locks in losses before the market recovers. However, while some anxiety is expected during times like this, if you are having trouble sleeping at night or are overly worried about your portfolio, let’s discuss ways to help you get to the sleeping point.
- Consider Roth IRA conversions or withdrawing from inherited IRAs. With values lower than they were 6 months ago, the tax impact of Roth conversions is currently lower, so you can benefit from converting while asset values are down and get tax free growth on the recovery. Similarly, withdrawing from inherited IRAs while values are down and reinvesting the proceeds in a taxable account can lessen the ordinary income taxes due now and allow you to pay long term capital gains on the growth in the future rather than ordinary income tax.
- Lean on us. We realize that even though bear markets can create unique opportunities, they also create stress. None of us like to see our account values drop. If you have concerns and want to discuss your portfolio, please reach out.
Times like this can be stressful, and we think markets will continue to be volatile for a while. However, as has happened in prior bear markets like this, we will work through what ails our economy, and the time may even come when we forget why we were so nervous in 2022. In the meantime, please don’t hesitate to reach out to us if we can help in any way.